best infographic makers for creating an infographic from scratch
I had a lot of fun researching and testing out a handful of different infographic makers, and I’d love to share the 12 tools I liked best. I hope this is the only list of resources you’ll ever need when creating beautiful infographics!
- Canva
- Venngage
- Piktochart
- easel.ly
- Visme
- Infogram
- Vizualize.me
- Snappa
- Animaker
- BeFunky
- Biteable
- Mind the Graph
1. Canva

- Price: Free
- Paid options:
- Freemium purchases: On the free plan, you have the option to buy premium templates, icons, images, and more for a more custom look.
- Canva for Work for small and medium sized businesses. Starts at $12.95 per team member, per month.
- Canva for Education offers teachers and students special pricing for their entire toolkit.
- Canva for Nonprofits gives eligible nonprofits free access to all Canva for Work features.
- Canva Enterprise offers companies with large design teams their entire toolkit with additional integrations to other platforms. Pricing on demand.
- Noteworthy feature: The free plan will take you pretty far!
- Ease of use: Easy
- Time required to create an infographic: 30 minutes
Canva is a powerful online design tool (and infographic maker) that allows you to create a variety of designs even if you do not have any design knowledge.
Canva provides a huge range of templates for you to pick from based on your exact design need — from birthday cards for a friend to a lesson plan for a class to social media banners, ad graphics, and many more. And of course, infographics.

Since we are looking to make an infographic, let’s take a look at the features Canva offers for you. You can pick from a variety of templates (the templates themselves are free, and some include elements like icons and pictures that you can purchase or replace with your own elements).
Here are some sample templates that Canva offers (all completely customizable):


(Click any of the above to enlarge)
Once you select your template (you can also select a blank canvas to start with), Canva offers a variety of options, including a vast library of elements (some free and some you can purchase). You can also upload your own and add to your image.
Et voila! You have your very own infographic!
Quick video tutorial:
2. Venngage

- Price: Free for students, paid for everyone else
- Paid options:
- Premium (for individuals) starts at $19 per month.
- Business (for businesses & organizations) starts at $49 per month.
- Nonprofits get 50% off all plans.
- Education plans with 35 accounts for the whole class start at $29 per month.
- Noteworthy feature: A great gallery of ideas for design inspiration, updated almost daily
- Ease of use: Easy
- Time required to create an infographic: 30 minutes
Similar to Canva, Venngage offers you a few different options to pick from in terms of what it is you want to create. You will find templates for things like reports, posters, promotions, and of course, infographics.
Within the infographic section, you will also find additional options to pick from that tend to deal with particular topics and categories of infographics, like:
- Statistical
- Informational
- Process
- Comparison
- Timeline
- Geographic
- Charts
- Tutorial
Below you will find a variety of templates to pick from (some free and some premium):


(Click any of the above to enlarge)
Once you find a template you like, it’s time to customize! Venngage allows you to insert what they call “Widgets,” which can include things like maps and charts based on the specific info and data you have for your infographic.
Quick video tutorial:
3. Piktochart

- Price: Free
- Paid options:
- Lite: $12.50 per month
- Pro: $24.17 per month
- Pro Team starts at $43.33 for 2 users per month.
- Nonprofits: $39.99 per year for individuals and $79.98 onwards for team plans
- Education: $39.99 per year for individuals and $79.98 onwards for team plans
- Noteworthy feature: Great step-by-step tutorials
- Ease of Use: Easy
- Time required to create an infographic: 30 minutes
Piktochart is another good option to create different types of infographics. You can pick from a few different formats, including a traditional infographic size (tall and skinny), presentation size (for slide decks), poster, and report.
You can then either create your own infographic from scratch or select one of their templates (some are free and others require you to either have a Lite or Pro plan). Here’s a sample of some of the Piktochart templates:


(Click any of the above to enlarge)
Once you have selected your template, you can simply drag and drop to add any graphic elements and text to your canvas. You can also upload your own images.
Quick video tutorial:
4. easel.ly

- Price: Free or Pro Account starting at $4/month
- Paid options: Called “Pro Accounts”
- Businesses and Nonprofits: $5 per month
- Teachers: $4 per month
- Students: $2 per month
- Enterprise: Pricing on demand
- Noteworthy feature: Free design sandbox you can play in without even registering for the service
- Ease of use: Easy
- Time required to create an infographic: 30 minutes
easel.ly makes it really easy for you to create infographics. When you arrive on their main page, all you need to do is pick one of the many templates they offer. They also offer a way for you to search their template library by category. Here’s a sample of some of the easel.ly templates:


(Click any of the above to enlarge)
Once you have found a template you like (or even when you start from scratch), you will be directed to a new window where you will be able to customize your infographic however you want. easel.ly provides a variety of tools such as backgrounds, shapes, text, charts, and more.
Quick video tutorial:
5. Visme

- Price: Free and paid plans
- Paid options:
- Standard: $19 per month
- Complete: $39 month
- Team: $117 per month for up to 3 users
- Enterprise: Price available on request
- Student: $30 per semester
- Teacher: $60 per semester
- Noteworthy feature: Make interactive infographics with links, animations and pop-ups
- Ease of use: Easy
- Time required to create an infographic: 30 minutes
Visme is a multi-faceted design tool that’s developed specifically with the marketer in mind. It allows you to create presentations, animations, mock-ups, banners, and of course, infographics.
Once you login with your account, you will be greeted with a visual of all your projects (the space will be empty if you haven’t created any projects yet). You can click on the Create button to get started.

Then it’s time to pick the type of project you would like to create — in our case, an infographic. You will notice that some of the templates are free to use and others require a premium account. Here’s a sample of some of the Visme templates (some are free and some require a premium account):


(Click any of the above to enlarge)
You will then be able to customize your infographic however you like with a variety of tools. Visme even allows you to add effects or animate objects inside the infographic.

Quick video tutorial:
6. Infogram

- Price: Free and paid plans
- Paid options:
- Pro: $25 per month
- Business: $79 per month
- Team: $170 per month starting with 3 users
- Enterprise: Multiple teams, starting with 10 users. Price available on request.
- Noteworthy feature: Paid versions of the tool offer SQL connectors, data analytics, link tracking and engagement analytics – nearly no other competitor offers such in-depth metrics.
- Ease of use: Intermediate
- Time required to create an infographic: 45 minutes
Infogram is a design tool for those who love numbers and data. Its strong data visualization chops help you create simple infographics from complex data sets. But from an artistic perspective, its templates feel somewhat limited. If you’re a free user, you’ll have even fewer choices.
Here’s a quick peek at some of their examples:


(Click any of the above to enlarge)
Once you have picked the template, you can edit the elements on the page. Infogram is a good option when dealing with statistics. When you need to assign numbers to graphs and maps, this is your go-to tool.

7. Vizualize.me

- Price: Free
- Paid options: None. It’s really, really free!
- Noteworthy feature: Specializes in building visual resumes
- Ease of use: Easy
- Time required to create an infographic: 10 minutes
Vizualize.me is a different type of infographic maker. It helps you create an “infographic resume.” Just log in and start creating your resume as you’d do in a Word template. You can even connect to LinkedIn to populate some of the information automatically.
On the left you will be able to input your information as well as pick the theme for your infographic resume.
Here is an example of a template and some very basic information I filled out:

Quick video tutorial:
8. Snappa

- Price: Free
- Paid options:
- Pro: $15 per user per month
- Team: $30 for 5 users per month
- Noteworthy feature: Surprisingly feature-rich, even for free accounts
- Ease of use: Easy
- Time required to create an infographic: 15 minutes
Snappa is a versatile little design tool that was a pleasant discovery for me. Most design tools offer bare bones functionality for their free accounts. Not Snappa. You get nearly all the features of paid accounts with the free plan, with the only exception being limited downloads per month for free users.
The tool lets novice designers create everything from social media content to infographics to custom designs, with plenty of built-in templates to choose from. Here are a few I liked:


(Click any of the above to enlarge)
Combined with its vast, free library of images, fonts, and icons (black and white as well as color), this tool packs a big punch in a small package.
Quick video tutorial:
9. Animaker

- Price: Free and paid plans
- Paid options:
- Personal: $19 per month
- Startup: $35 per month
- Business: $59 per month
- Noteworthy feature: Build richly animated infographics without a digital video professional
- Ease of use: Intermediate
- Time required to create an infographic: 45 minutes
Primarily an animated video development tool, Animaker also offers the option of building animated infographics. With a built-in library of animated characters, scenes, icons and images, users can pick and choose their story elements to build an animated infographic step by step.
As with other tools, Animaker offers a variety of animated templates to use as the foundation for your infographic. Here’s a sampling of what they look like.

Each template is essentially a video that is then dropped into their graphic editor to be customized for your needs.

Building the infographic itself is straightforward, though a little time consuming. However, that’s probably to be expected for a fully animated, video infographic.
For someone who’s never created a video before, there’s a slight learning curve that non-animated infographic tools don’t typically have. Also note that you do need to have Flash Player enabled to use the tool.
Quick video tutorial:
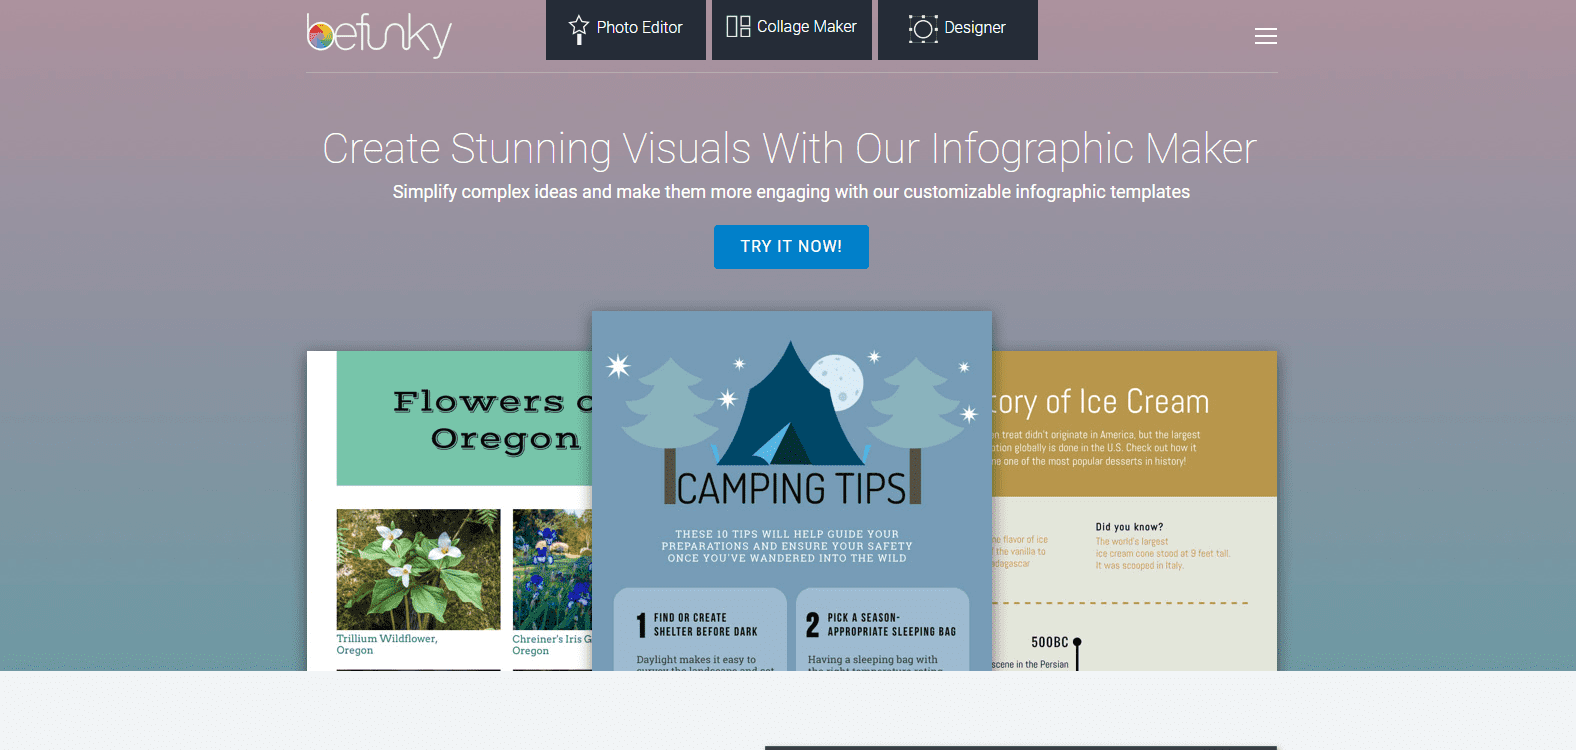
10. BeFunky
- Price: Free and paid plans
- Paid options: BeFunky Plus is available at $6.99 per month.
- Noteworthy feature: Superb photo editing capabilities with a free library of images and expert-level vector graphics
- Ease of use: Easy
- Time required to create an infographic: 30 minutes
BeFunky is a tool to help non-designers create professional looking designs and edit photographs like trained pros. The infographic maker is a part of their design package and uses the same drag and drop interface as the rest of the tool.
With just one free infographic template, the tool can be a tad limiting for free users, but it does offer a much wider variety of templates with the BeFunky Plus plan.

The tool has a built-in connection with free image libraries Pixabay and Unsplash, saving you the trouble of getting out of the tool to look for the perfect images for your infographic. The photo editing options available here are far more advanced than in a typical infographic maker. Helpfully, BeFunky also has an extensive tutorial section that explains step by step how to give professional effects to each image.
Quick video tutorial:
11. Biteable

- Price: Free and paid plans
- Paid options: Biteable Premium is available at $29 per month (includes video maker)
- Noteworthy feature: A video infographic maker that’s easy to use
- Ease of use: Easy
- Time required to create an infographic: 30 minutes
Biteable is a powerful video creator that lets you create HD quality videos for free. And since we’re all about infographics here today, let me assure you that you can definitely build convincing looking video infographics with this tool.
It has a number of infographic video templates that you can pick from and edit to your heart’s content.

With tons of stock footage, icons, fonts and more, designing my own video infographic on Biteable is quick and simple for even a novice.
Free users can publish their custom infographic videos directly to YouTube and Facebook, while the paid plan lets you download them, store them inside your Biteable account, or publish them to the social channel of your choice.
Quick video tutorial:
12. Mind the Graph

- Price: Free and paid plans
- Paid options:
- Student: $5 per month
- Researcher: $9 per month
- Noteworthy feature: A one-of-a-kind scientific infographic maker
- Ease of use: Easy
- Time required to create an infographic: 30 minutes
Mind the Gap was created with the research community in mind, though it’s open to all to use. It provides over 3,000 awesome scientific illustrations and customizable infographic layouts.
(Which other infographic maker gives you such detailed graphics of bacteria, amoeba and molecules?)

Here are some templates from the tool:


Starting with a basic free plan (no free templates!), this rather affordable tool offers progressively greater levels of customization and design options with paid plans.
Quick video tutorial:
Watch me build an infographic in an afternoon (in 3 minutes)
The key to working fast on an infographic? Finding a solid template! I’m really grateful for the amazing infographic makers out there that make it as easy as can be. Check above for a quick video of how I tried my hand at creating my own infographic!
A couple highlights:
- 0:09 – Found a great template!
- 0:40 – Drag-and-drop design parts
And here is my finished infographic. Total time to create: 15 minutes!
Quick tip on sharing infographics to social media
One of the amazing benefits of infographics is that they’re a wonderful visual asset for sharing on social media. The only catch: They’re not quite the ideal sized image for sharing.
Twitter and Facebook tend to favor horizontal or square images, and infographics are extremely vertical! (Great for Pinterest, btw.)
One thing we’ve done to work around this:
Take screenshots of different parts of the graphic.
For instance, with my infographic I built above, I could share this smaller-sized image as a teaser for the infographic.

Over to you
I find it incredible how easy it is to create beautiful infographics nowadays. I hope these tools will be helping in you creating your own. Good luck!
Good examples of infographics. I want to make a similar infographics on my website. Very simple and clear information for the client.
ReplyDelete